Shopify Revenue Agent Uncovers Leaks with SQL Trees
This playbook walks you through building an AI Flow that dissects ecommerce revenue drivers across a customer base. The LangGraph-based system breaks down top-line metrics into their component parts, identifies root causes, and delivers prioritized recommendations to improve performance
Ecommerce operators face a persistent analytics challenge: despite mountains of transaction data, they struggle to quickly diagnose why revenue performance fluctuates. When the quarterly numbers come in showing that revenue is down 3.2%, the critical questions begin:
Is this a product relevance issue or a site experience problem?
Should we adjust our acquisition strategy or focus on conversion rate?
Which specific metrics are driving these changes?
Which segments deserve immediate attention versus longer-term optimization?
Traditional analytics approaches fall short in answering these questions because they:
Require manual exploration of disjointed datasets across multiple tools
Lack of structured frameworks for breaking down revenue into its component drivers
Provide descriptive statistics without causal analysis or prioritized recommendations
Need specialized analyst teams to translate findings into actionable business strategies
The consequences are costly: delayed responses to emerging issues, misallocated marketing budgets, and missed opportunities to replicate successful patterns across segments. When revenue underperforms, ecommerce teams often resort to broad-brush tactics like site-wide discounts rather than precision interventions that address specific root causes in each customer segment.
The "Tree of Lifetime Value" methodology provides a structured approach to analyze revenue drivers. However, implementing it at scale across multiple segments requires significant time and expertise.
A LangGraph-based System
This playbook demonstrates how to build an AI workflow that analyzes ecommerce data and generates actionable insights to boost revenue. The system connects to your BigQuery data warehouse, performs a breakdown of revenue drivers, and provides targeted recommendations.
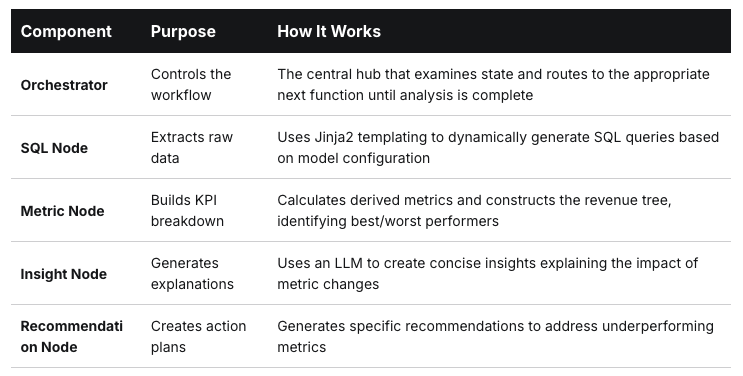
The workflow uses LangGraph's orchestrator pattern to process data through a series of specialized functions:
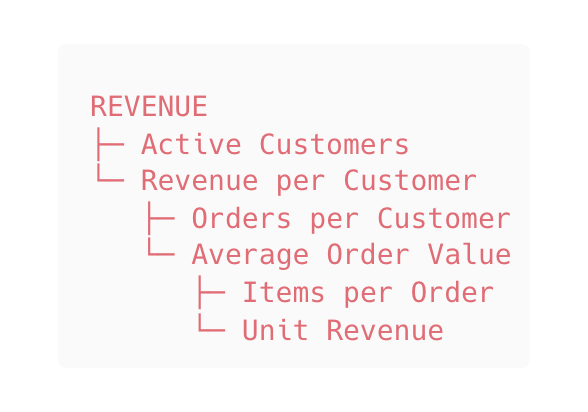
The Revenue Tree
The core analytical framework breaks down revenue into its component drivers:
This hierarchical approach helps pinpoint exactly where changes in revenue are coming from. The system color-codes metrics based on year-over-year performance (green for positive, red for negative) and automatically identifies the best and worst performing areas.
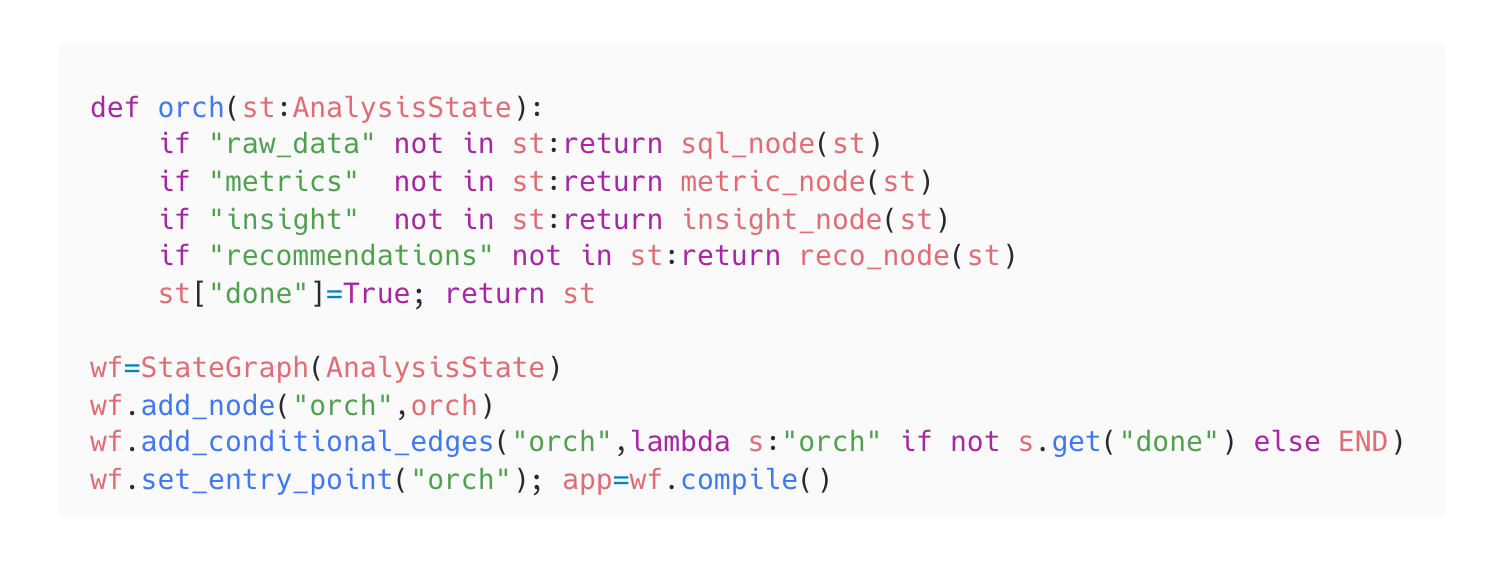
The workflow uses an "orchestrator pattern" in LangGraph, which streamlines the implementation:
This pattern uses a single node with a conditional edge back to itself, keeping the graph structure clean while maintaining all the benefits of a workflow system.
Running the notebook is simple - connect to your BigQuery instance, define your data model, and let the AI workflow do the rest. In seconds, you'll have a complete analysis of your revenue drivers and specific actions you can take to improve performance.
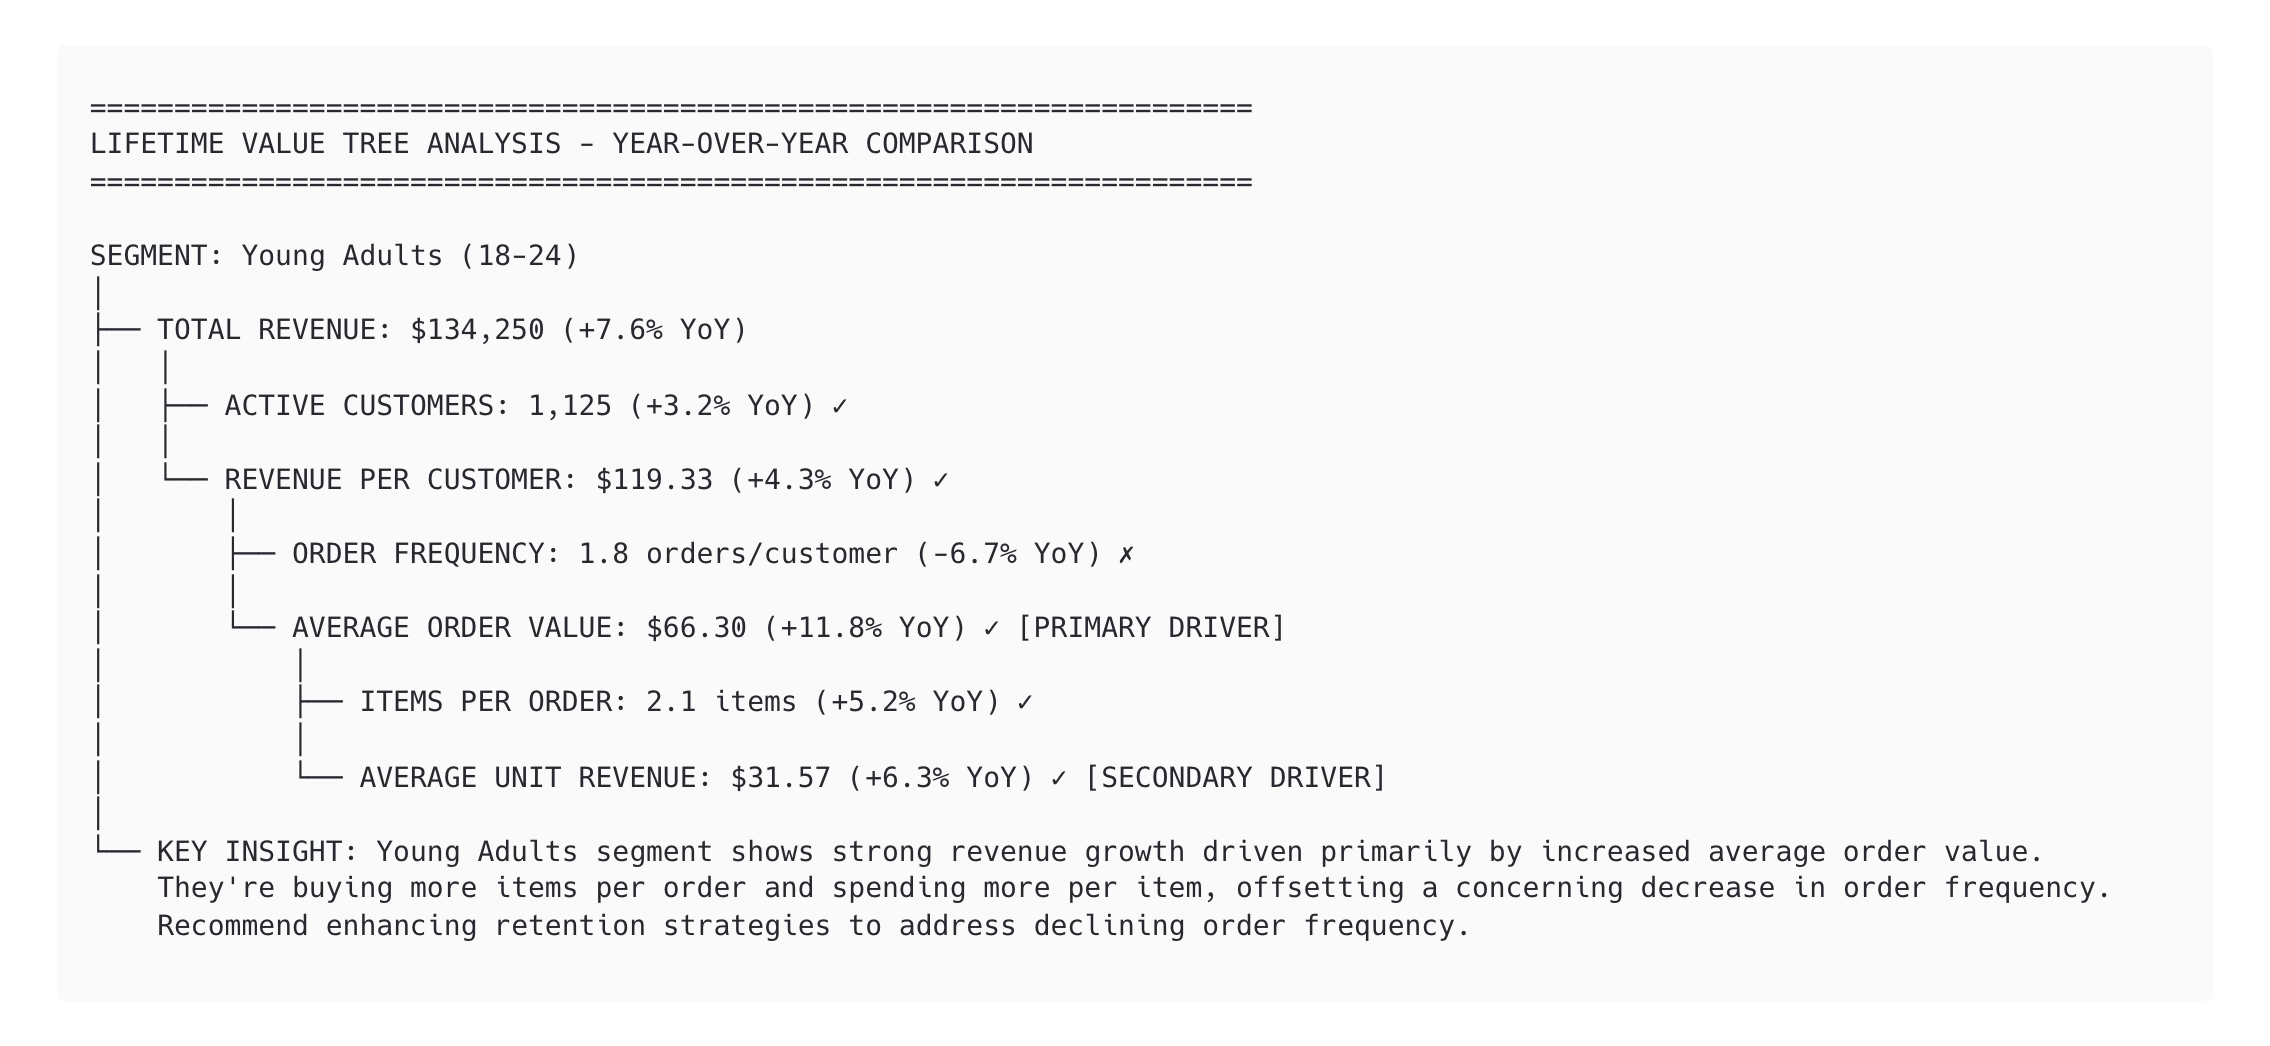
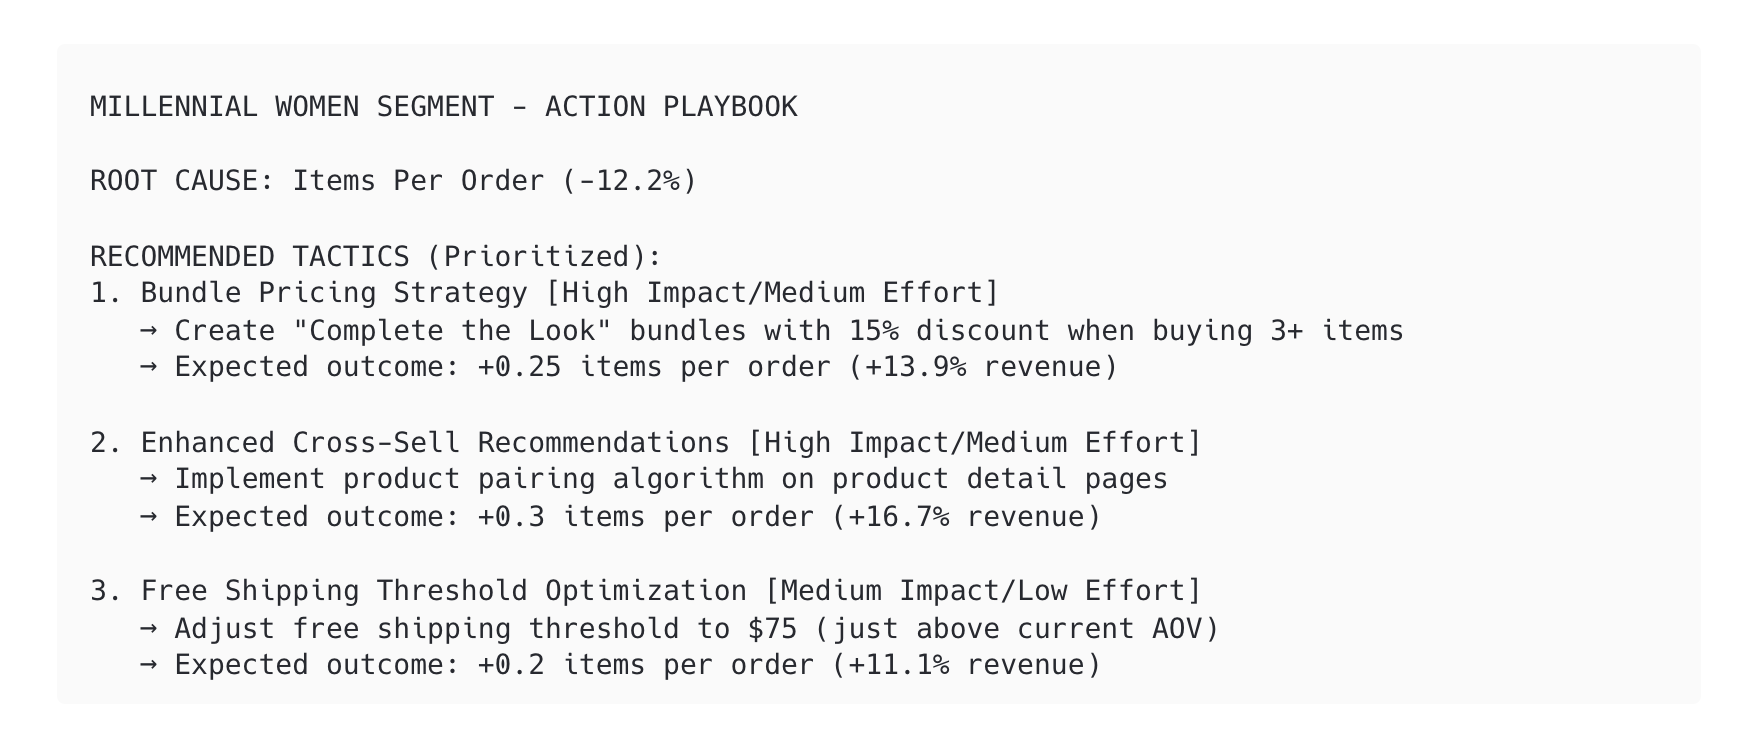
The solution produces detailed lifetime value tree analyses for each customer segment, identifying root causes of performance changes and recommending targeted actions:
For segments with identified issues, the system generates prioritized recommendations:
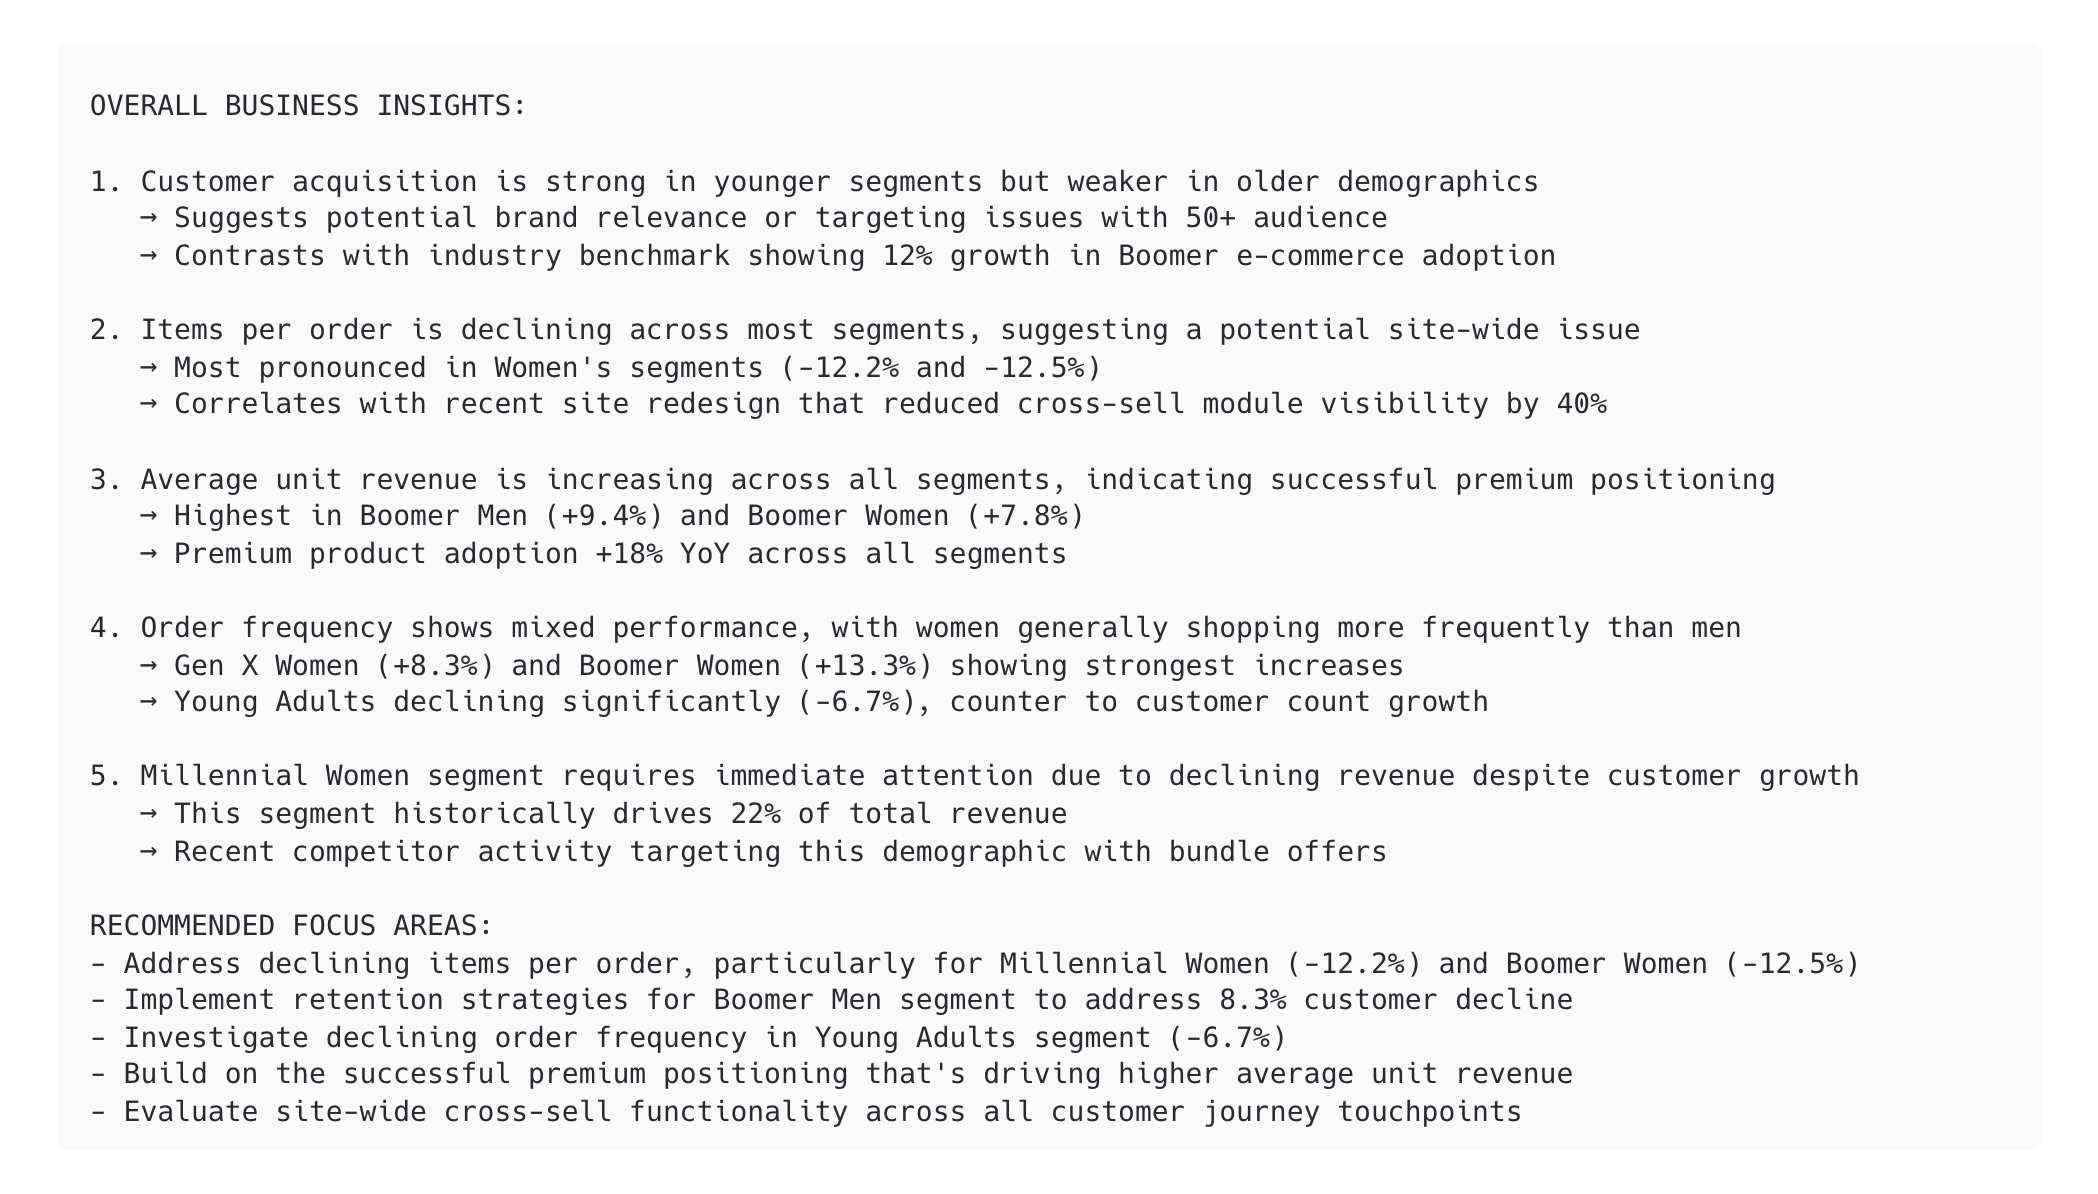
Beyond segment-specific analysis, the system performs a meta-analysis across all demographics to detect broader patterns and structural issues that require company-wide strategies. This comparative analysis identifies:
Common Drivers: Metrics that consistently influence performance across multiple segments
Demographic Trends: Performance patterns that correlate with specific demographic characteristics
Emerging Opportunities: Cross-segment bright spots that could be expanded
Systemic Weaknesses: Widespread challenges that suggest platform or policy issues
By correlating performance patterns across segments, the system can distinguish between isolated issues requiring targeted interventions and systemic challenges demanding broader strategic shifts. This prevents the common pitfall of addressing symptoms rather than root causes.
Here's an example of the cross-segment intelligence the system generates:
This system bridges the gap between raw transactional data and strategic decision-making by orchestrating specialized agent nodes through a structured workflow. The system doesn't just identify problems - it reveals the precise levers that drive revenue performance for each customer segment.
Business leaders can move beyond the frustrating experience of knowing something is wrong but not understanding exactly why or what to do about it. Instead, they receive a clear diagnosis of underperforming metrics, contextualized across segments to reveal segment-specific issues and broader business patterns.
Most importantly, the solution connects analysis directly to action, turning insights into concrete implementation plans with quantified impact estimates. This fundamentally changes how ecommerce teams operate, shifting resources from manual data exploration to actual execution of high-impact initiatives that directly address the root causes of revenue challenges.
🚀
Grab the Colab playbook with the end-to-end LangGraph AI workflow for optimizing Shopify revenue - available for all Pro members.
The Customer Segments
The CLV tree uses the following predefined segments that are present in the BigQuery tables:
This post is for paying subscribers only
Sign up now and upgrade your account to read the post and get access to the full library of posts for paying subscribers only.