This playbook builds a pipeline that analyzes customer behavior, predicts who is actually still buying, finds the ones slipping away, and pipes them to Claude Code for automated winback campaigns.
Traditional customer segmentation groups customers into Champions, At Risk, and Hibernating based on recency, frequency, and monetary value. This is also called RFM segmentation. But RFM assigns recency scores based on absolute days since last purchase, not relative to each customer's buying pattern. A weekly buyer at 30 days and a quarterly buyer at 30 days get the same R score, even though 30 days means something completely different for each.
This playbook finds customers labeled Champions who stopped buying. The pipeline learns each customer's purchase rhythm, calculates who's likely still active, and outputs data you can pipe to Claude.
0:00
/1:04
hatch run pipeline | claude -p "create Klaviyo winback flow for churned VIPs"
The pipeline outputs structured analysis that Claude can act on. Pipe it with a prompt and get back Klaviyo flows, email copy, or discount strategies tailored to your actual churned VIP list.
🚀
This playbook builds a pipeline that learns each customer's purchase rhythm, calculates who's likely still active, and flags the ones slipping away before your standard reports notice.
How It Works
The model learns each customer's personal purchase rhythm. A customer who bought 6 times then went silent for 90 days is much more likely to be gone than someone who bought twice and went silent for 90 days.
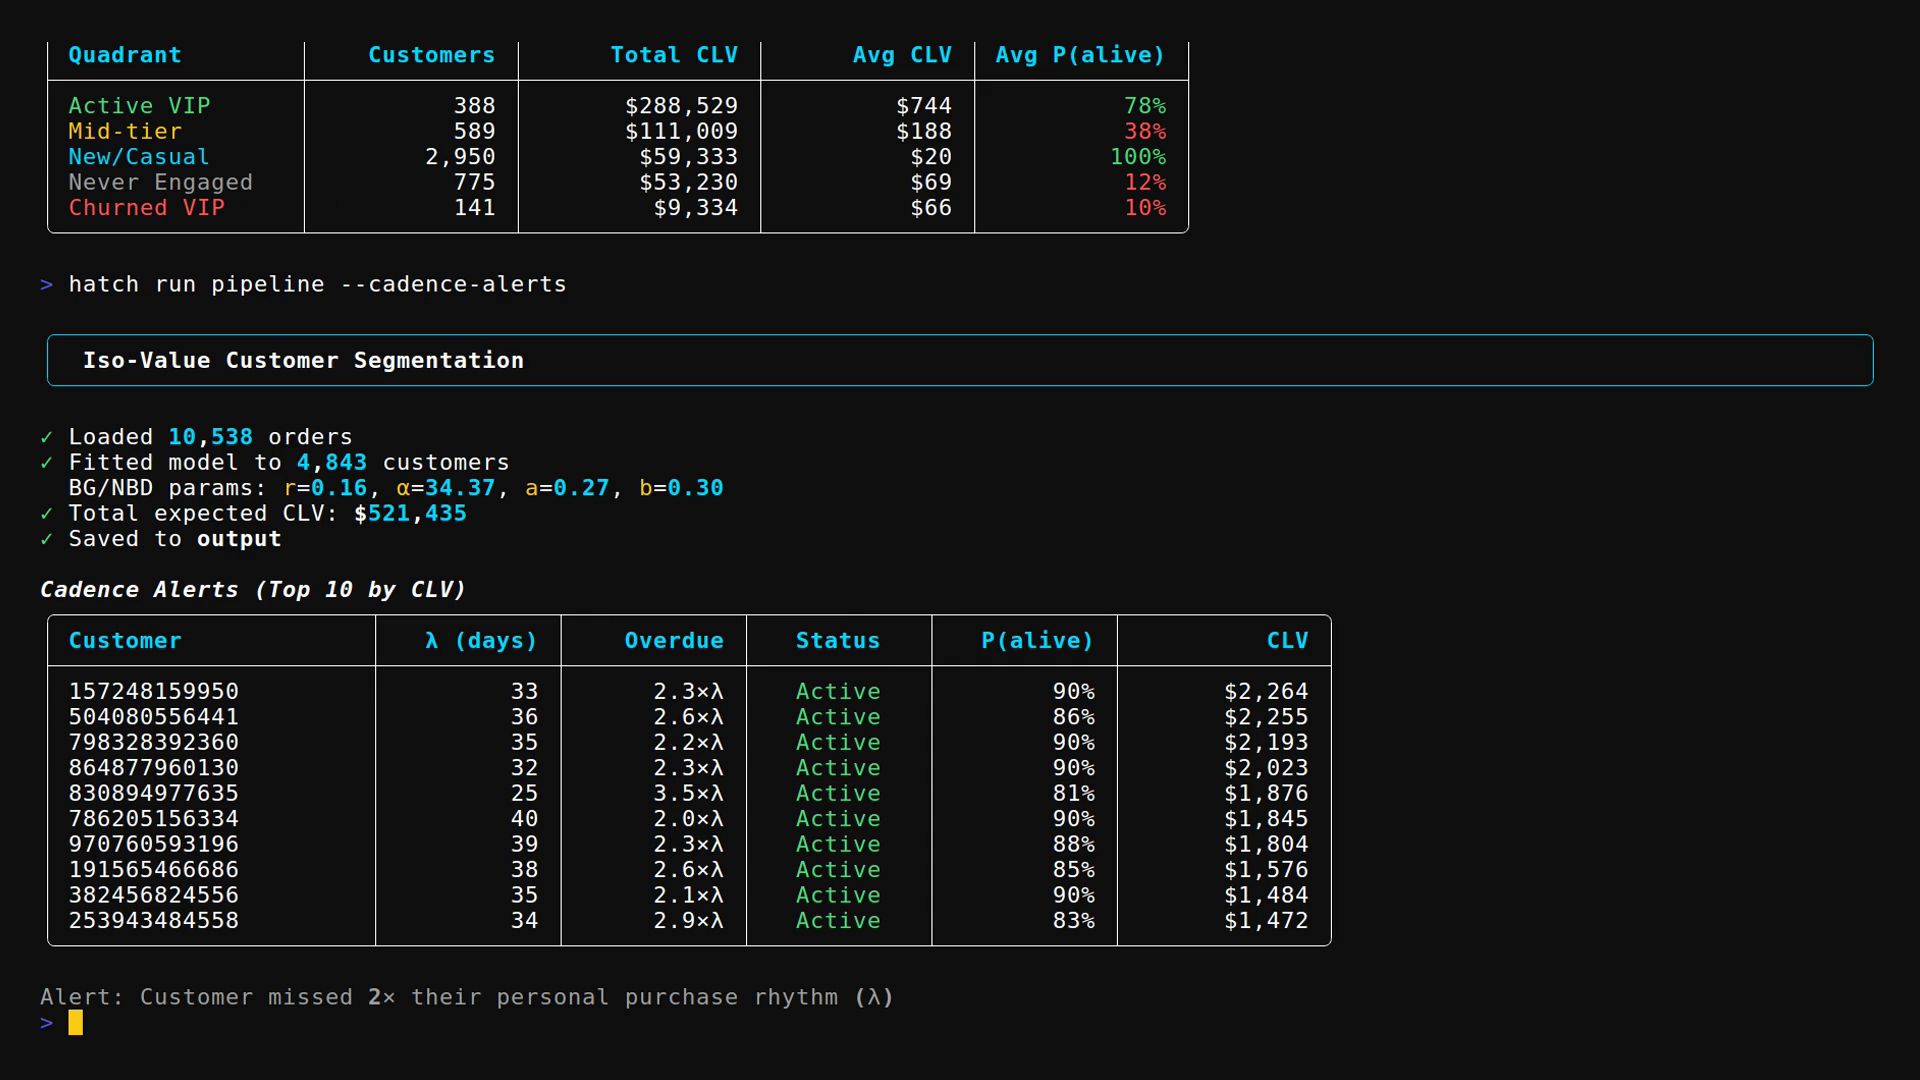
The pipeline calculates likelihood of still being active for every customer, then multiplies by expected future purchases to get forward-looking CLV.
It also generates cadence alerts when someone misses 2× their usual rhythm. A weekly buyer at 21 days is overdue. A quarterly buyer at 21 days is fine.
The Backward-Bending Paradox
The counterintuitive finding: high frequency + high recency = low CLV.
        F=1    F=2    F=3    F=4-5   F=6+
R<30    $20    $354   $266   $680   $1,763  ← active, valuable
R 60    -      $529   $298   $535   $1,268  ← still engaged
R>120   $20    $92    $148   $254   $488    ← dead zone
Look at the F=6+ column. At R<30, these customers are worth $1,763. At R>120, they're worth $488. Same purchase count, 3.6× difference in value.
These are churned VIPs. High historical frequency, so RFM labels them "Champions." But they haven't bought in 120+ days. Their likelihood of returning is near zero. The model knows they're gone. The pipeline flags them so you can run winback campaigns before writing them off completely.
What It Produces
Per-customer likelihood scores and expected CLV, exportable to Klaviyo. Plus a list of customers missing their usual purchase cadence, sorted by value.