Track how customers move between RFM segments to identify downgrades worth thousands per month. This playbook reveals when customers migrate between segments and when they need a Klaviyo trigger, whether that's a win-back or a nudge up.
RFM segmentation tells you where customers are right now. You have a bunch of customers flagged "At Risk." That's useful, but it doesn't tell you the most important thing: where did they come from?
Knowing someone is At Risk is one thing. Knowing they were Champions last month is another. Static segment snapshots hide the most actionable signal: trajectory.
This playbook tracks how customers move between RFM segments over time, quantifies the revenue impact of each migration path, and generates reverse ETL payloads for automated state-change triggers. No more batch campaigns. State changes fire flows immediately.
hatch run pipeline --alerts outputs pipe-friendly CSV of critical downgrades. Pipe it to Claude Code and get back a full Klaviyo trigger strategy:
hatch run pipeline --alerts | claude -p 'Build a Klaviyo trigger strategy for these segment migrations. Include flow triggers, conditions, and recommended actions for each transition.'
The pipeline outputs structured data that Claude can act on. Instead of manually building flows from exported lists, pipe the output with a prompt and get back trigger conditions, flow logic, and recommended actions tailored to your actual migration data.
Running the Playbook
The pipeline compares RFM segments across two time periods (typically 30 days apart) and builds a migration matrix showing customer flow between segments. After cloning the repo (with Claude Code/OpenCode or without) you get the following package:
Or connect to BigQuery by setting credentials in .env:
hatch run pipeline --source bigquery
Segment Migration as a State Machine
Segment migration treats RFM segments as states in a state machine. Customers transition between states over time. The technique is simple: snapshot your RFM segments at two points, join on customer ID, then analyze the transitions.
Customers moving from Champions to At Risk. That's the biggest revenue leak.
Why State Changes Matter More Than States
Most teams run periodic campaigns where every At Risk customer gets the same email every Monday, regardless of when they actually dropped into that segment. A customer who fell from Champions to At Risk on Tuesday doesn't get reached until the following week, and by then you've lost the window where intervention actually works.
Meanwhile someone who's been sitting in At Risk for three months keeps getting the same campaign over and over. The fix is to stop treating segments as static lists and start treating them as state machines where the transition itself is the trigger. A customer who just became At Risk yesterday is a completely different problem than someone who's been there for a quarter, and your flows should reflect that.
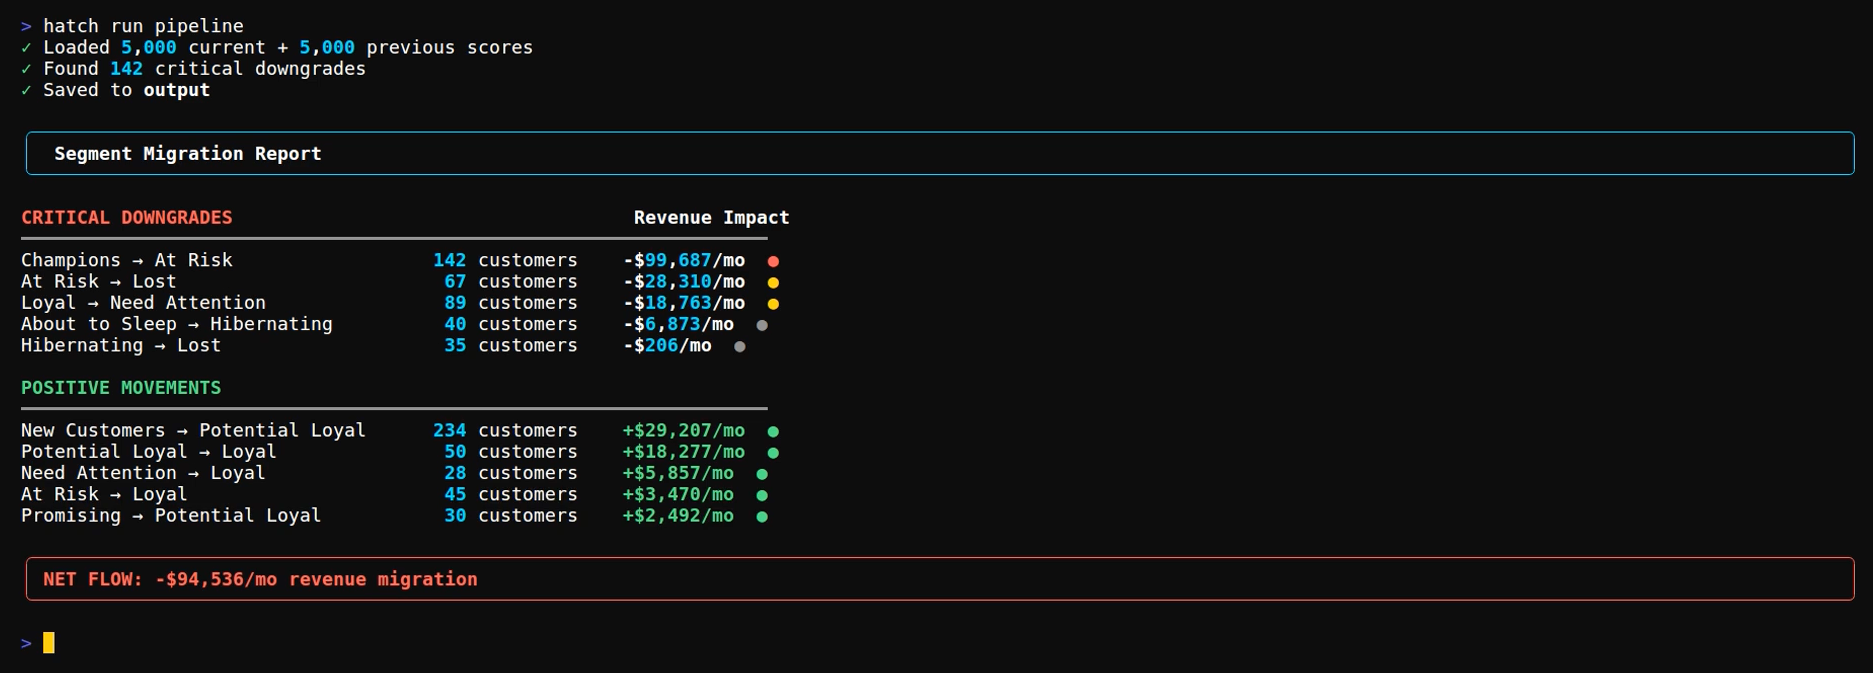
What It Produces
The pipeline outputs a summary showing critical downgrades, positive movements, and net revenue flow:
Segment Migration Report

CRITICAL DOWNGRADES                                    Revenue Impact
━━━━━━━━━━━━━━━━━━━━━━━━━━━━━━━━━━━━━━━━━━━━━━━━━━━━━━━━━━━━━━━━━━━
Champions → At Risk         142 customers              -$99,687/mo  ●
Loyal → Need Attention       89 customers              -$18,763/mo  ●
At Risk → Lost               67 customers              -$28,310/mo  ●

POSITIVE MOVEMENTS
━━━━━━━━━━━━━━━━━━━━━━━━━━━━━━━━━━━━━━━━━━━━━━━━━━━━━━━━━━━━━━━━━━━
New → Potential Loyal       234 customers              +$29,207/mo  ●
At Risk → Loyal              45 customers               +$3,470/mo  ●

NET FLOW: -$94,536/mo revenue migration
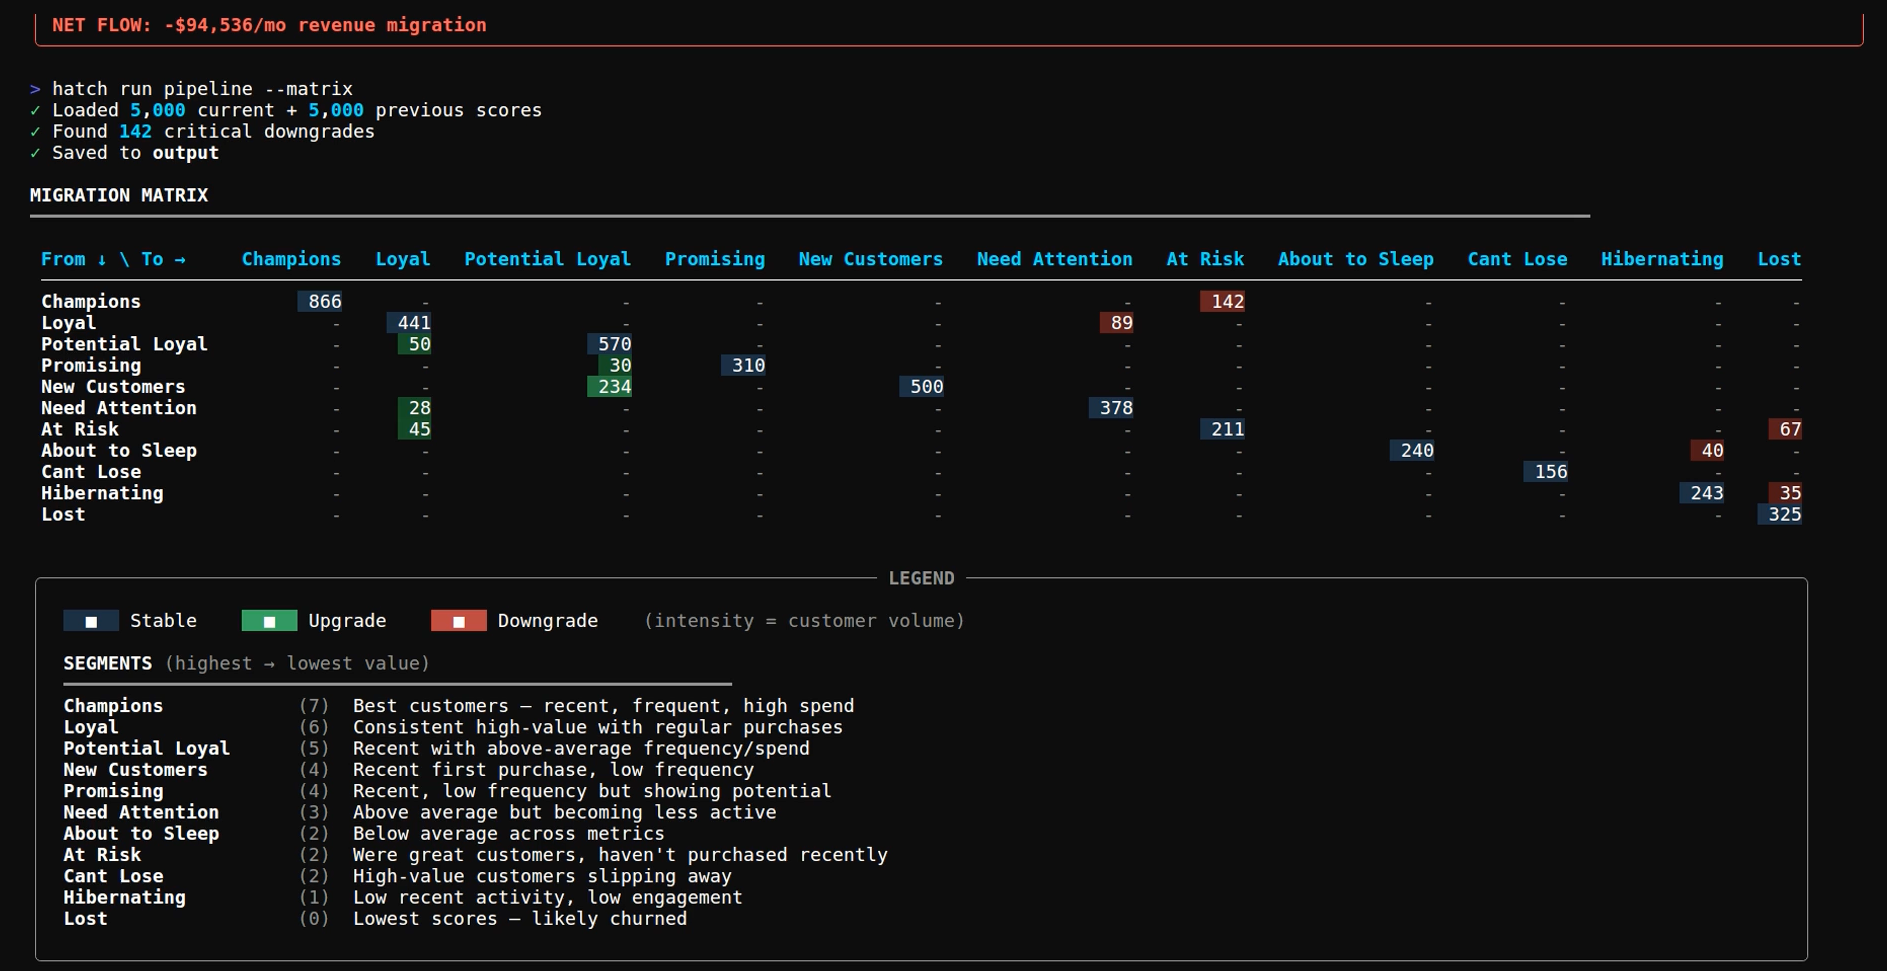
The --matrix flag shows the full from-to migration grid:
MIGRATION MATRIX
━━━━━━━━━━━━━━━━━━━━━━━━━━━━━━━━━━━━━━━━━━━━━━━━━━━━━━━━━━━━━━━━━━━
              To →   Champ   Loyal   NeedAt  AtRisk  Lost
From ↓
Champions            812     34      12      142     8
Loyal                28      356     89      45      12
Need Attention       -       28      98      34      18
At Risk              -       45      12      156     67
Lost                 -       -       -       23      445
The diagonal represents stable segments. Off-diagonal cells represent movement.
The pipeline generates reverse ETL payloads ready for platform integration:
klaviyo_updates.json - Profile updates with migration_status and previous_segment properties for flow triggers
meta_audience.json - Custom audience of critical downgrades for retargeting campaigns
google_customer_match.json - Customer match list for similar audience expansion
These files connect segment state changes to automated marketing actions. Push them to platforms via reverse ETL connectors.
Migration Priority Framework
Some migrations matter more than others. Here's a rough framework:
| Movement | Priority | Action |
|----------|----------|--------|
| Champions → At Risk | Critical | Personal outreach, discount, concierge support |
| Loyal → Need Attention | High | Re-engagement flow, new product launch notification |
| At Risk → Lost | Track | Sunset sequence, remove from active campaigns |
| New → Potential Loyal | Positive | Nurture working, continue current flows |
| At Risk → Loyal | Recovery | Win-back worked, analyze what triggered recovery |
Critical downgrades get immediate intervention, positive movements get reinforcement, stable segments get regular cadence.
Common Mistakes
Comparing mismatched time periods. December to January looks like churn because of holidays. If you sell seasonal products, compare the same month year-over-year instead of month to month.
Ignoring segment size. Not all downgrades are worth investigating. Set thresholds relative to segment population so you're not alerting on noise.
No dollar values. Reporting "50 customers downgraded" means nothing to leadership. Attach revenue impact to every migration so the numbers translate into budget conversations.
Manual campaign execution. You export the list, upload to Klaviyo, build the campaign. By the time you get to it, they're already gone. Push segment changes as profile properties and let flows trigger automatically.
Only tracking downgrades. When customers move from At Risk to Loyal, your win-back is working. That's signal worth investigating. Figure out what caused it and do more of that.
What You Learn
After running this for a few cycles you start seeing patterns. What triggers churn: failed deliveries, competitor promos, expired discounts. Whether your win-back flows actually recover anyone. Which acquisition channels produce customers that downgrade fastest. If most of your downgrade revenue comes from one migration path, you only have one problem to solve.
Running the Pipeline
The playbook includes test data scored across two periods so you can see results immediately. To use your own data, either replace data/rfm_current.csv and data/rfm_previous.csv with your RFM exports (keeping the same column format), or configure BigQuery in .env and point it at your RFM scores table.
This post is for paying subscribers only
Sign up now and upgrade your account to read the post and get access to the full library of posts for paying subscribers only.